26 May 2017

General Election: 2015 Data - Turnout Data


Link for fly-through: http://live.datascapevr.com/viewer/?wid=c26b2318-ec14-457a-9ae5-dc64bc0fc6e1


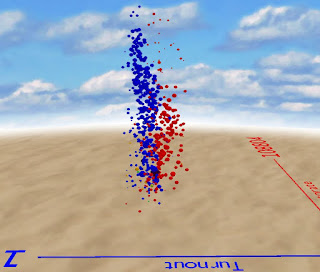
Just testing out a minor update for Datascape when I decided to plot the 2015 General Election results data on a scatter plot, not geographically. I chose:


  • X: electorate
  • Y: Margin/majority
  • Z: Turnout
  • Size: Size of UKIP vote
  • Colour: Winning party

A quick fly around of the data revealed a number of interesting points:


In the high margin/majority space it is the Conservatives that dominate. More big majority, safe homeland seats.


It is at the small majority end where we tend to see the smaller parties - few of them have massive majorities in their seats.


 The SNP wins are generally associated with very high turnouts. The dots (yellow) are small as there was minor/no UKIP voting and that is what we've mapped to radius.


And the most striking - looking at the turnout axis the Conservatives dominate in the high turnout seats and Labour in the low turnout seats. Cause or effect?

Update: 7 June 17


Here's another visualisation we really like - just showing the vote for each of the main parties across all the constituencies. The fly-through link is:

http://live.datascapevr.com/viewer/?wid=7959ce9e-5cce-4b7d-8dd4-44adeddea7e7

18 May 2017

London Undergound Data in Datascape


Inspired by the TfL talk at VRWorld I thought it was about time we got some TfL data in Datascape, so I managed to put this together before I got home from the conference.

Doogal's site has a downloadable list of tube station locations (lat/long) (https://www.doogal.co.uk/london_stations.php) which was a good start. The TfL Open Data site after registration then let me download the station entrance counts for weekdays for 2016 (as daily averages I assume) for 15 minute slots through the day. A bit of Perl scripting combined the two files, and split the TfL table into a single column, and some tidying to get station names to match! Then into Datascape. In all these visualisations height is the 24 hour day, each disc is a data sample for a 15 min period, and width and colour is proportional to the number of people entering the station at the time.

You can fly through a subset of the data yourself in 3D or VR (Cardboard) by following this link in any WebGL capable browser: 


Full dataset, the column with a fat base at the centre of the map is Waterloo

Flying in to Oxford Circus - bulging at home time

Flying out along the Northern Line - note some stations have an evening bump as well as a morning one


Showing a sample every 3 hours in the Web/VR version to get general trend


Close up of Web/VR version - we limit to 5-10k points at the moment for performance


We'll explore some of the other TfL datasets over the next few months, and we can support multiple datasets in a visualisation so you could switch between entrance and exit data, or weekdays and weekends.

Replacing the Open Street Map map with a 3D model is certainly possible - we can do model imports ourselves but haven't added it yet as a public function. And moving the whole experience into Hololens is certainly something we'd like to do in the future.

But for now you can just download a trial of Datascape for free and start publishing your data visualisations in 3D on the PC, web and VR.

A short unedited video flythrough is below - but try the link at top for the full 3D/VR experience.


All the data is (c) 2017 Transport for London and used under the Open Government Licence v2.0.

17 May 2017

VR World Report

I spent the last couple of days at VR World down in London. The event was busy pretty much the whole time and the 3 open lecture areas had a good mix of talks and discussions. There were also a good number of exhibitors showing  a range of AR/VR apps and kit, although nothing that really blew me away.

Photo report below, but main takeaways were:

  • Almost more AR/MR (Hololens) than VR
  • Far more Vive than Oculus (can understand that from a developer's perspective)
  • A few Cardboard based apps
  • Nobody showing Gear VR - whereas previous events I've been to have been full of them
  • A few haptic input devices, but no-one showing gloves
  • Still a lot of 360 video/photosphere stuff
  • Does stringing together a set of other peoples VR videos count as a presentation?
  • Some people had really been drinking the VR Kool-Aid with the "this will change the world by 2020" type speeches and stats - it won't, it's just another tool
  • Very few people showing analysis frameworks of how this all fits together
  • A few people showing some good evaluation stats, even more calling out for everyone to share them - been calling for that for ages
  • Nobody really doing data visualisation
  • Just one company doing authoring - and more a Unity-light approach for simple photosphere menus
  • More doing training then education

Now the photos:

How VR can fill the gap in medical training

Some nice promo type work from JauntVR


And some nice stats about impact

Nice guidelines on MR (and VR) development from Viscopic

Some great data from Touch Surgery - and this was 3D not VR surgery training - surgeons did better than trainees - so valid

The learning effect - with repetition people got better

Proper control group testing

More improvement in the group using the 3D trainer

A touch interface - but one interface too many on the demo rig?

A physical labyrinth explored with Vive and backpack PC

Fracture showing some nice Hololens demos of city data - see below

Affordable and easily integratable slippery feet walk controller - may well integrate with Fieldscapes 
Hollywood production values in Rolls Royce robot ship control demo


Very neat though - and no-one wearing any headsets!

Better view of Fracture in the TfL demo - see next blog post


10 May 2017

2015 General Election Results - Risk vs UKIP


Click link for live 3D fly-through: http://live.datascapevr.com/viewer/?wid=31a96f33-6196-4dcb-b408-4e1c6fa6aee9

We've started to play around with election data in Datascape. We're not political analysts, so please forgive any errors/simplicity in the analysis - we're just seeing if we can get Datascape to give us some interesting views and perspectives on the data.

In this visualisation we've plotted the 2015 results for each constituency (exc NI - the ONS file doesn't have the geocodes).

The key is:


  • Colour = winning party
  • Height = 1/margin between 1st and 2nd place
  • Width = Number of UKIP votes
Broadly speaking if any column has an obvious thickness to it then the number of UKIP votes is at least the size of the majority/margin. One of the current lines of analysis appears to be that many of the UKIP votes will go Conservative - so Labour (red)  seats with a reasonably small majority (almost any appreciable height on our visualisation), and with a large UKIP vote (any width) could be good candidates to go Tory.

In the office we're going to start to work from this and other visualisations our predictions of which seats are going to switch, and if we're brave we'll post it here the day before the election!

Just click on the link above to fly through the data, and hover over any bar to see the detail. If you've got Google Cardboard then you can even fly through the data in VR!


Note: You might see that there's a UKIP win over the Greens in Buckingham in middle England - which didn't happen! The reason is that the ONS/Electoral Commission data for that seat appears to be missing entries for the 3 major parties (and others) - so according to the data it's a UKIP win. This actually highlights Datascapes ability to immediately draw the eye to errors in the data!

9 May 2017

Trainingscapes Website Live


Our Trainingscapes website is now live. This is the professional/commercial/vocational counterpart to Fieldscapes. Whereas Fieldscapes is a single, shared service aimed at educators, Trainingscapes - using the same core technology - is delivered as standalone instances for clients, branded to them, and run either hosted on on their own servers.

The Trainingscapes web site also has case studies of our work over the last decade in 3D immersive training on a wide variety of projects, many of which were delivered on earlier versions of the PIVOTE authoring engine which underlies Fieldscapes and Trainingscapes.

You can check out the new web site at www.trainingscapesvr.com.

8 May 2017

General Election data in Datascape #1


With the General Election looming in the UK we've been after getting consitituency location data into Datascape so we can do some good plots of the historic, poll and results data. Finally tracked down as good source at the ONS Open Geography portal - thanks guys.

Above plot shows each constituency centre point and a rough idea of its size. We're not doing detailed boundary stuff yet - would be hard to see for whole country anyway given the huge range in sizes - most 2D maps use pop-outs for the major cities.

There will no doubt be issues over a) boundary changes and b) non-standard spellings of constituency names - but at least it gives us a start!

16:39 Update

And first plot already - merged in electorate (height) and 2015 turnout (colour).


Click on the link below to launch in your browser or view in MobileVR on your smartphone/Cardboard.

http://live.datascapevr.com/viewer/?wid=4d3a9f46-fca7-4bf5-923e-535483fd5b8e